
Run code and generate charts in chat
Dovetail chat can now run code to answer quantitative questions and render the results as inline charts.
When you ask a question that requires counting, grouping, or calculating—like "how many participants mentioned pricing as a churn reason this year?" or "show me a breakdown of feedback themes by quarter"—chat writes Python and executes it in an isolated AWS Bedrock AgentCore sandbox against your search results. It returns precise numbers instead of a qualitative summary. Every figure is citable, so you can trace each number back to the underlying notes, highlights, and data points it came from.
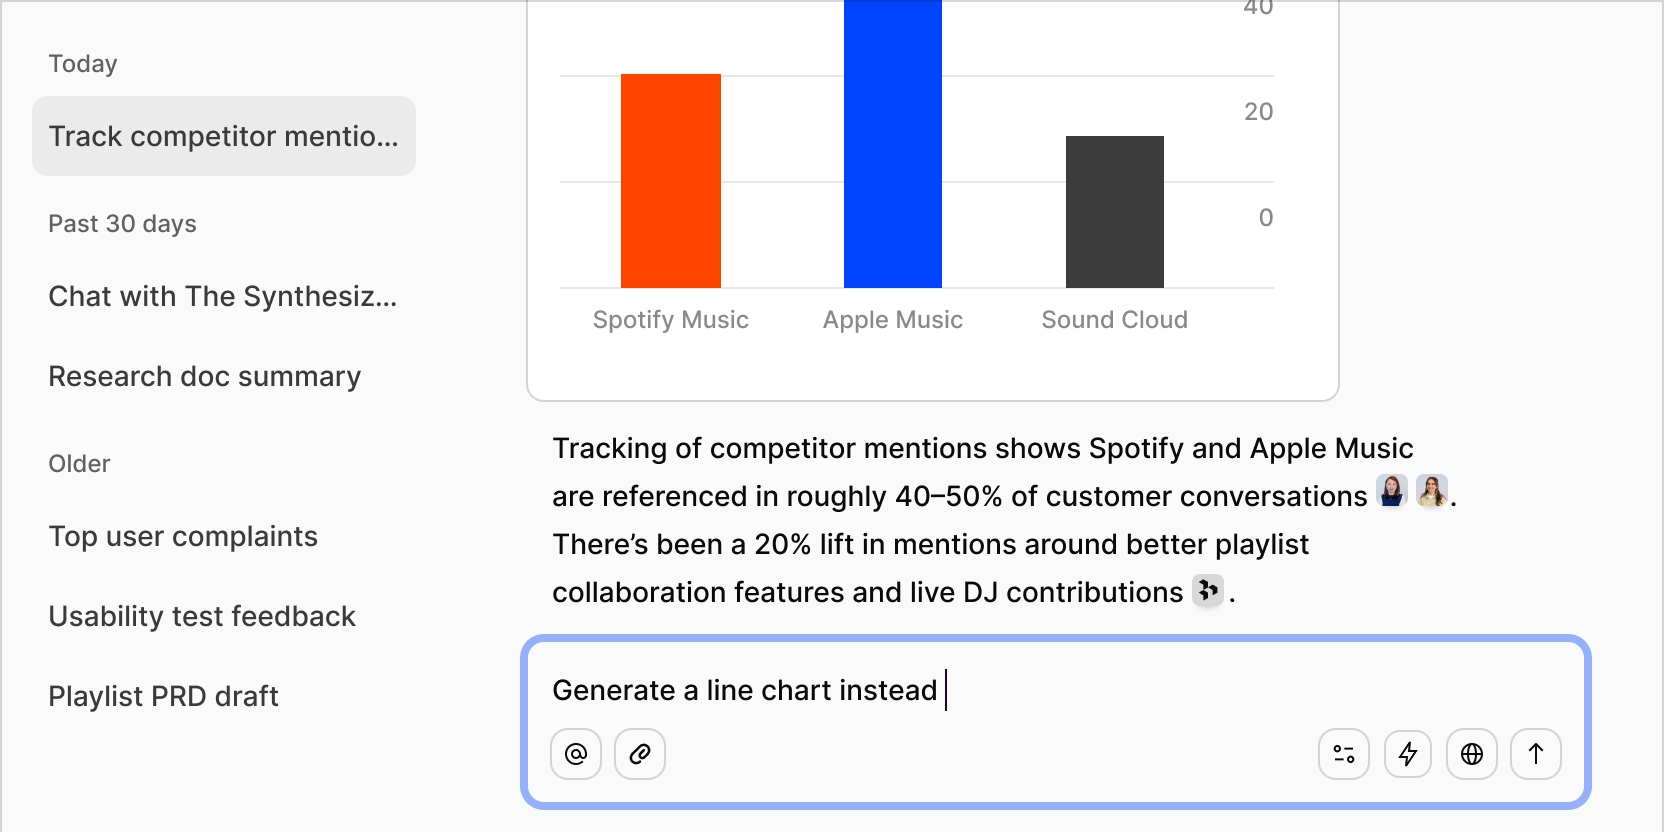
You can also ask chat to visualize the results. Chat generates a chart by running the same Python execution pipeline and returning structured data that renders inline as a bar, line, or pie chart. Because the chart values come from the same sandbox run as the prose, the numbers always match. Charts persist in the conversation and reload when you come back to them.