What is UX storyboarding?
Working in a large organization with over 100+ employees? Discover how Dovetail can scale your ability to keep the customer at the center of every decision. Contact sales.
Empathy is a crucial ingredient in designing user-centered user experience (UX). It allows you to understand your users' desires, emotions, and pain points so you can come up with a design that delights them.
But how can you capture all their demands and ensure your whole team understands them?
That's where storyboards come in.
These sequential illustration tools help contextualize a product and offer insights into user expectations.
Let's dive deeper into:
What storyboards are
The differences between storyboards and journey maps
The components of storyboards
When you can use them.
You'll also learn how to craft a storyboard in simple steps.
Don't let UX problems go unnoticed
Use Dovetail to analyze all your customer interviews and uncover hidden UX issues that are costing your business every day.
Analyze with Dovetail
What is a storyboard?
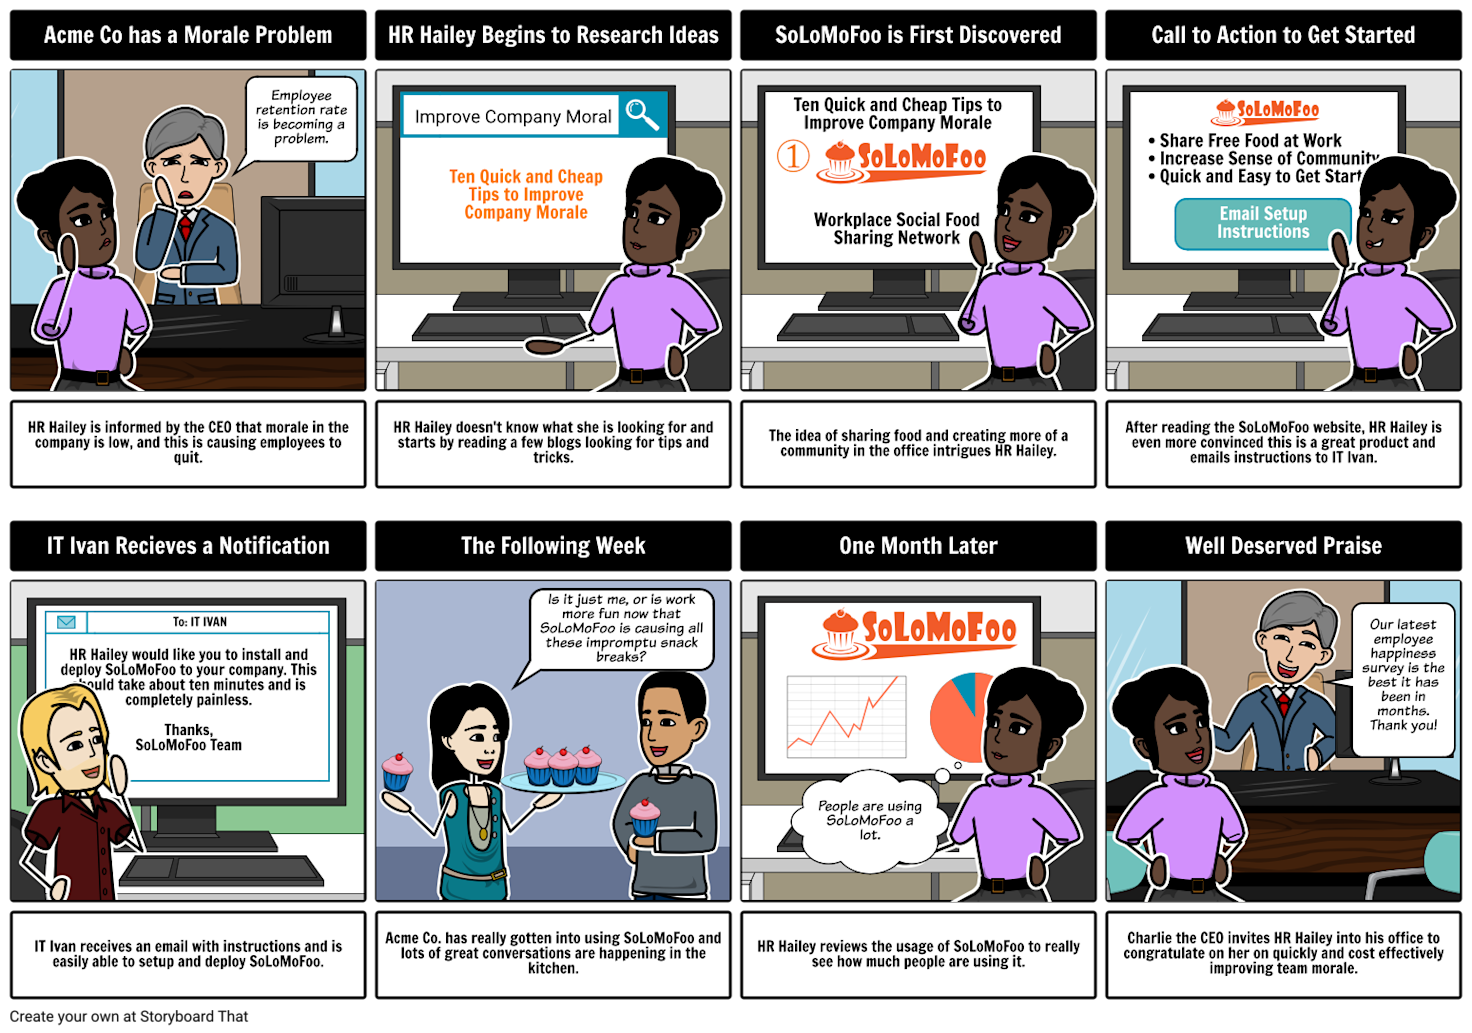
A storyboard is a linear sequence of image panels that chronologically visualize a story's events. The illustrations and scenarios are typically simple, making them memorable.
Storyboards gained popularity from Walt Disney's centuries-old practice of sketching fantasy worlds before crafting the actual films. Comic books also employ storyboards.
In the UX world, this concept powers ideation. Designers can combine many elements in a storyboard, including persona, the user journey, and study findings to develop product requirements.
The result?
Complex ideas are turned into simple words and illustrations.
Storyboards vs. journey maps
A user journey map is a macro view of the steps your buyer takes to attain a specific goal. It uses text to describe the entire process—from when your user hears about your product to the purchasing stage and beyond.
A user journey map is a big-picture illustration that:
Contextualizes a product and brainstorms features it needs
Describes the various steps, customer's emotions, actions, and thoughts, plus insights you can glean from each stage
Pinpoints specific pain points or forges interdepartmental collaboration
Storyboards are mostly informal illustrations of steps in simple graphics or images. They lean more on imagery and less on accompanying text. They don't offer as much context as in the user's journey; the captions' primary purpose is to help you understand the imagery.
A storyboard is often a narrow-use, detail-oriented tool that:
Establishes context for everyone working on a given issue
Describes a part of the journey map; you may require several storyboards to understand different branches of the map
Why use storyboards?
Since crafting a storyboard usually happens before diving deeper into the UX process, it can guide your team through further activities. It helps:
Capture usability test results
A storyboard can capture how people in usability testing interacted with the product, removing arbitrary interpretations. While textual summaries of the test are helpful, visuals are easy to memorize and skim.
Pro tip: throw in the participants' quotes or illustrations of any telling body language.
Enrich user journey
Storyboards can visualize user interaction with the application, their device, and the environment. Enriching experience mapping helps design the product with your users in mind, rather than relying on your imagination.

Prioritize issues
Prioritization ensures you focus on the most crucial features that your user needs. Your development and design teams won't waste time on unnecessary functionalities, boosting productivity and lowering costs.
Discussing the images as a storyboard team forges a shared understanding of essential features, and they can always refer back to the common knowledge.
Kick-start ideas
You may not have real data about a user's experience or environment, especially if you're at the start of a project.
How about using a storyboard to power your imagination and kick-start conversations around the process? This can help you to empathize with your user as a collective team while exploring solutions from an end user’s perspective.
Over time, you can iterate the idea and product as you collect real insights.
When is storyboarding useful?
Storyboards can be helpful at any stage but are particularly useful during the discovery and building phases.
The discovery phase of a new product
During the discovery phase, all stakeholders (including designers, researchers, developers, and users) should be able to share their ideas and understand the concept.
Storyboards allow you to explain the new product to all these groups without scaring anyone with complexities. They also help summarize research findings and user-interview responses.
The building phase
Whether developing a new product or fine-tuning an existing one, you need to inject insightful data and findings into user stories. Communicating these insights during the development phase is essential, especially if it involves several short sprints and many designers.
Data-rich storyboards help the entire team focus on modeling your user's experience around the application.
When is there no need for a storyboard?
Storyboards aren't always necessary. Most of the time, a storyboard is more of a supporting element when your app or solutions have touchpoints outside the typical on-screen interactions.
Teams building IoT (Internet of Things) solutions, for example, may need to examine or present solutions involving steps outside the technology, or across multiple forms and touchpoints of the technology. Other times, when ample data has been collected, additional illustrations can help stakeholders visualize a solution.
But the key is to know when you need to create a storyboard or trust your data and reporting to tell the story. Your goal should always be to ensure all stakeholders agree on the way forward. If people are misunderstanding the data, or teams are getting split, maybe you should try storyboarding.
Components of a storyboard
An effective storyboard has the following elements:
Scenario
At the top, name your user persona and briefly describe their user story (user scenario). The descriptions should be clear at first glance.
For example:
Persona: Human resource, Edward
Scenario: To be able to give compensation directly through the payroll tool
Visuals
Visuals display the steps in the user story through images, graphics, or sketches. The visuals can be simple or elaborate, depending on purpose and audience.
Visual designers should include relevant details such as the user's environment, quotes in speech bubbles, and the device (screen) being used.
Captions
Include a caption for each visual. These textual components describe the user's device, environment, emotions, actions, and other details.
They're usually concise (only a few bullet points per caption), allowing the images to steal the show.
How to create storyboards
Here are some tried-and-true steps that help create robust storyboards and user experience design:
1. Gather data
First, decide on the data that will enrich your storyboard, for example:
Application metrics
Interview findings
User testing results
You can still storyboard if you're using it for the ideation phase and don't have real data yet.
2. Cherry-pick fidelity level
Your storyboard's audience and objective will dictate the infidelity level. A brainstorming meeting and sketches will help you to discuss steps and timelines in an easy-to-understand way.
Pro-tip: Using sticky notes on a whiteboard will allow you to easily rearrange ideas.
If you captured usability test results, use video stills and photos from the sessions. These visuals remove the need for sketches and inject authenticity into the story.
Want to show the story to a client? Tools such as Canva or Adobe Illustrator can help you present a well-polished, more in-depth story. But focus on telling the story instead of trying to perfect your illustrations.
3. Define the persona and scenario
Specify the scenario and stick to the rule of “a single storyboard for a single user path.” You don't want your storyboard to become a flowchart with different directions.
A UX storyboard should only be used for a specific, more complex, or harder-to-understand concept you’re seeking to highlight. There are better tools to illustrate multi-directional flows or capture entire flows.
4. Plan out steps
Grab a pen and paper and write down the individual moments you plan to convey in your storyboard. Next, connect them with arrows, or sketch them on Post-its so you can move them around as needed.
Use emoticons to notate any additional useful information, for example, conveying the persona's emotions and thoughts at each step.
5. Create visuals and add captions
Turn the steps into chronological sketches of frames that will contain the visuals. Unless it's necessary for presentation purposes, there's no need to create high-quality illustrations. Low-fidelity sketches or stick figures are easy to create and help designers and stakeholders focus on the solution, not the illustrations.
Remember to sprinkle a few caption bullets below each image if the reader needs additional context.
6. Distribute and iterate
Don't stop there; your story has just begun. Distribute the storyboard to the intended audience, request feedback, and iterate where necessary—on the solution, not the storyboard.
FAQs
What is the golden rule of storyboarding?
The golden rule of storyboarding is this: a single user path for a single storyboard. That way, you'll avoid splitting it into multipath scenarios and help your internal team have a single purpose.
What are the key elements of a storyboard UX?
A UX storyboard consists of three elements:
A scenario that describes the persona and user story
Visuals to illustrate the story
Captions underneath each visual
What is the difference between a scenario and a storyboard UX?
An interaction scenario is a concise, clear text description of the user story. Storyboard UX is a tool that visualizes the user’s steps chronologically using visuals and corresponding captions.
What is UX storytelling?
UX storytelling describes the UX process with the end user in mind. It involves getting insights from user research to describe the users, their pain points, and how you can weave together the solutions.
What are storyboard techniques?
Storyboard techniques include:
Traditional storyboard: these tools are pencil sketches that help visualize the story.
Thumbnail storyboard: if you are a one-person team or a small team that understands how you should design the product, using captions and detailed sketches is unnecessary.
Digital storyboard: creators of animated videos employ this method to maintain the exact graphics in the final video, reducing the element of surprise.
Should you be using a customer insights hub?
Do you want to discover previous user research faster?
Do you share your user research findings with others?
Do you analyze user research data?
Editor’s picks
Last updated: 24 June 2023
Last updated: 29 May 2023
Last updated: 6 March 2025
Last updated: 6 March 2025
Last updated: 27 November 2024
Last updated: 18 December 2024
Last updated: 16 February 2025
Last updated: 22 December 2024
Last updated: 31 January 2025
Last updated: 1 February 2025
Last updated: 8 January 2025
Last updated: 26 February 2025
Last updated: 1 February 2025
Last updated: 26 February 2025
Last updated: 31 January 2025
Latest articles
Last updated: 6 March 2025
Last updated: 6 March 2025
Last updated: 26 February 2025
Last updated: 26 February 2025
Last updated: 16 February 2025
Last updated: 1 February 2025
Last updated: 1 February 2025
Last updated: 31 January 2025
Last updated: 31 January 2025
Last updated: 8 January 2025
Last updated: 22 December 2024
Last updated: 18 December 2024
Last updated: 27 November 2024
Last updated: 24 June 2023
Last updated: 29 May 2023