What we learned from creating a tagging taxonomy

Everyone needs a house to live in, but a supportive family is what builds a home.
- Anthony Liccione
At the heart of the Atomic Research approach is the idea that the most fundamental unit of a research insight is not a report, but a research nugget. A nugget is a combination of an observation (something we learned), evidence (video snippet of a user describing the experience in their own words), and tags that allow for slicing and dicing the data. Insights are then synthesized from collections of nuggets stored in a centralized database.
The foundation of a solid atomic research structure is a taxonomy that defines what and how to tag. Tagging decisions turn research into a useful and powerful resource for an organization. Tagging taxonomies establish an agreement about how to collect, interpret, and act on research. They create a shared understanding of an organization’s domain, products, and services. Taxonomies communicate an opinion about what’s important and inspire the exchange of insights across the organization. They also order research so someone new to the organization or a team can quickly get up to speed on the users’ experience.
The components of an effective taxonomy
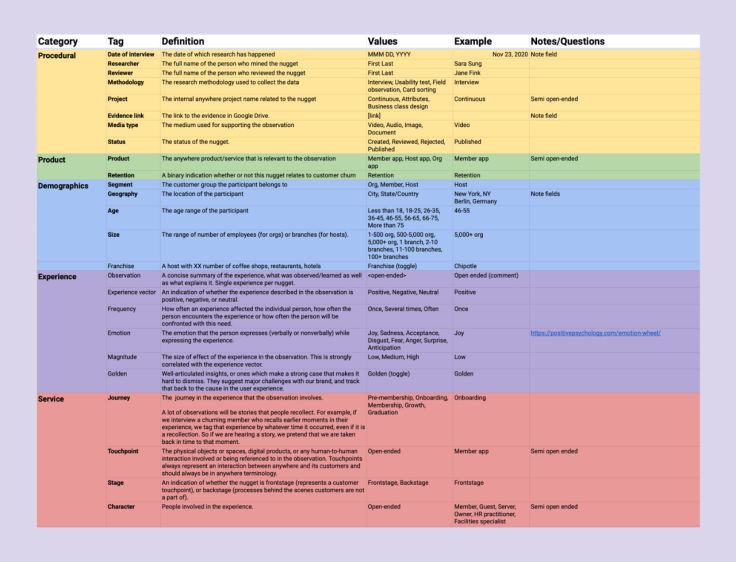
To make a taxonomy of tags relevant and useful, create about 25 tags organized into five groups. Even if you can identify a lot more tags, limiting the taxonomy to 25 tags makes the tagging process quick (just a minute or two per nugget) and effective. We found that overly elaborate taxonomies take more time to tag and are prone to tagging mistakes and other failures. We recommend to keep it relatively simple and straightforward while including a handful of open-ended tags that allow much-needed flexibility. A second critical component of a taxonomy is a clear definition of each tag. The following are the tag groups we found to be useful for us.
Procedural: Tags that provide data about the mechanics of the research and the nugget. Here we tag the media type (video, audio, other), the nugget approval status, methodology used, researchers involved, who nuggetized, and more [NB: creating an atomic level insight, or a nugget, is referred to as nuggetizing, and the researcher conducting the action is a nuggetizer. - Ed.].
Product: Tags to reflect product-oriented classification, such as the product the nugget is related to (relevant for an organization with a portfolio of products), and additional indications.
Demographics: Tags that describe details about the research participant’s demographics. Tags such as age range, gender, geographic location, etcetera, are relevant here.
Experience: Tags that describe the research participant’s experience. Whether it was positive or negative, frequent or not, which emotions were involved, and more.
Service: Tags related to service design like the user journey, touchpoints, characters involved as well as free form keywords that describe the content of the nugget.
Creating a useful tagging taxonomy is important. As we have created ours and based on past experience in creating taxonomies for other projects and organizations, we have collected ten juicy lessons we have learned along the way. We believe these would be helpful for you when you create (or refresh) your tagging taxonomy.
Planning a tagging taxonomy
Be patient when planning a tagging taxonomy. It is unlikely you will develop a perfect system from the start.
Create tags with intent, tie them directly to research goals, and evaluate early and often. Consider applying tags across current and future projects.
The following are lessons we have learned during the critical stage of planning a taxonomy of tagging.
Lesson 1: Consider how tags will be consumed
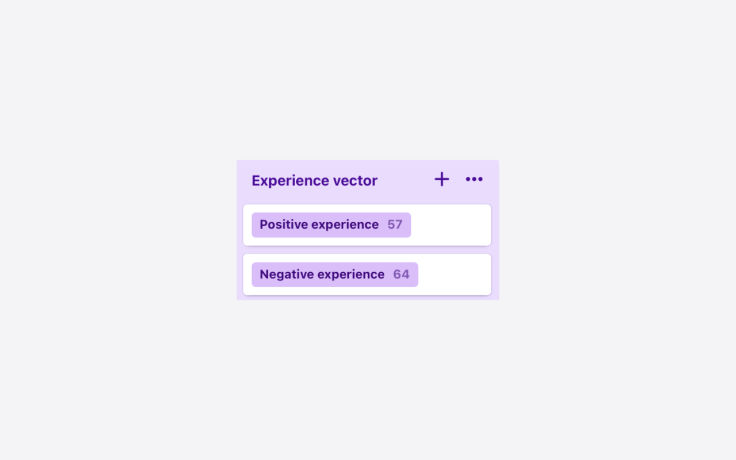
When you choose your tag labels within a tag group, consider how your tags will be consumed. How will other members on the research team and other teams within the organization think to search for and review nuggets? Start with tags that connect directly to your research questions. This will build your framework. From there, think about adding tags within different tag groups as you synthesize your research and as other themes emerge. Remember: You want to make tags both usable for the long term and not too time-consuming to understand. For example, if you have set the research question: What are the positive and negative effects of working from home on employees? It might be a good idea to include a tag such as “Experience vector” with “Positive” and “Negative” value options.
Lesson 2: Plan for a learning curve
Start slowly when developing and using a tagging taxonomy. Whether it’s your first time building one or not, plan for a learning curve. This means evaluating your tagging taxonomy as you go. As a team, we would evaluate our taxonomy’s effectiveness after each of us had a chance to synthesize findings into tags. Our conversations led us to make adjustments to the tags as needed, ensuring a universal understanding of the tags, and agreement on proper additions to our tag groups. It’s best to make changes as early on in the process as possible to prevent inconsistencies in tagging; make corrections as needed, and move forward.
Lesson 3: Use universal tags
After we tagged around ten interviews, we determined our taxonomy could be used across our projects. Unfortunately, we did not create the initial tags to be used across projects, preventing us from broadly using them. We ended up recreating our entire tagging taxonomy to include the ability for universal usage across projects. This resulted in having to re-tag all of the nuggets we had previously tagged with the new universal tags, which could have been a tedious process, but it wasn’t too bad since we caught it before we tagged dozens of interviews. As you are planning your tagging taxonomy, make sure what you have created can apply to other projects. If so, set up your tags to a universal usage setting. This will streamline your work and save you precious time.
Organizing a tagging taxonomy
Tags introduce a simple way to organize your research. Set the right structure from the onset. This will make it easier down the line to filter for specific tags that can support your insights.
Lesson 4: Just enough tags
You’ve built a taxonomy, and now it’s time to put it into practice! It’s an exciting moment, and naturally, you are eager to take advantage of each tag as much as possible when looking for research insights.
In and of themselves, tags do not stand alone, but rather, each tag feeds into the evidence section of a project. As such, a tag is an opportunity to highlight a theme or observation that can help inform future product recommendations or affirm hypotheses. If you include too many tags in your taxonomy, you’ll be overwhelmed with the time required to tag and complexity involved in the process. Too few tags or just allowing nuggetizers to add keywords as tags freely without any structure, and you’ll struggle to capture any insights at all.
Lesson 5: Secondary research tags add depth
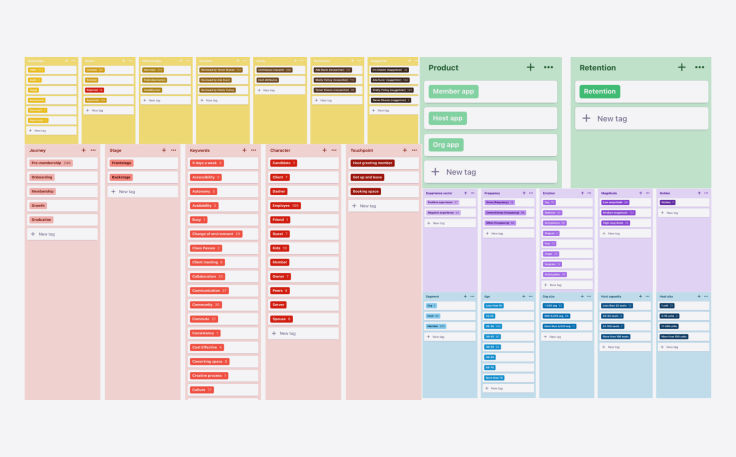
In addition to conducting primary research (i.e., research we conduct directly with participants), we also invest in secondary research. Such research (also called, ’desk research’) involves gathering research others have done or finding other resources which might support our primary research effort.
We knew we wanted to step outside of our own work and get a higher-level understanding of trends related to the domain we are interested in. For secondary research, we looked to articles, podcasts, webinars, and reports by institutions such as the World Economic Forum. All of these sources were structured around discussing the new work from home experience, and what the future of work might look like, which is the domain we were interested in.
Through collection, analysis, and compilation of secondary resources, we developed a broad array of secondary research tags. These tags give us insights outside of our own data collection. As a result, we added layers of understanding to why certain themes and topics were popping up in interviews with our participants, and in turn, this helped validate our findings.
Lesson 6: Tying color to action
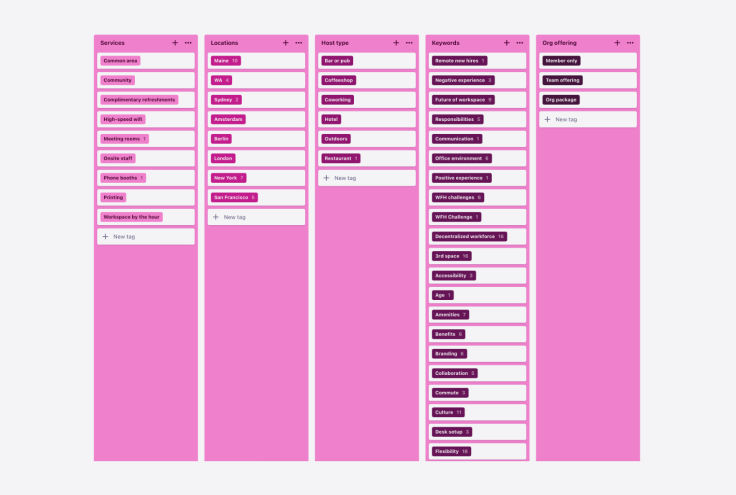
Think of tag colors like a monopoly board – the hues help you understand how far you’ve moved around the board. In Dovetail, colors allow the tagger to visually skim and remember if they’ve successfully tagged the whole nugget.
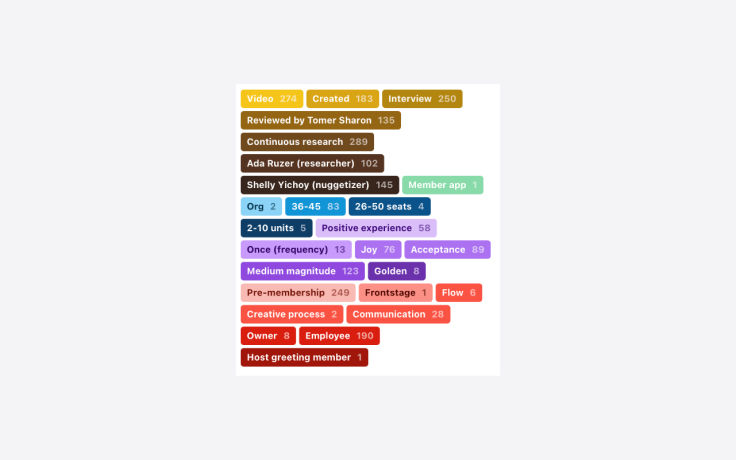
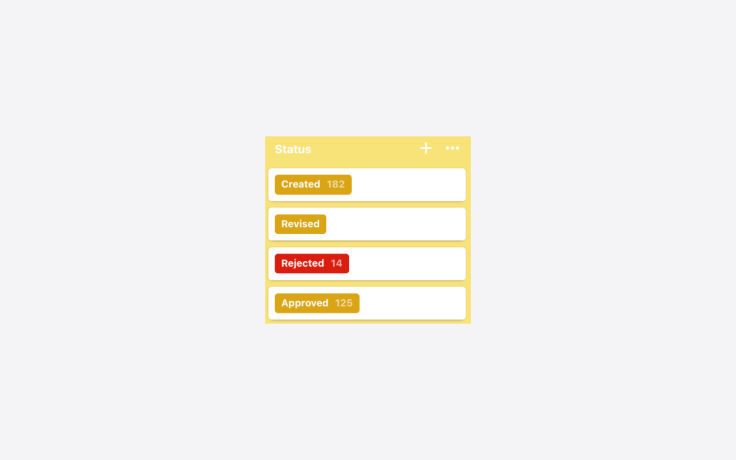
Colors also serve the purpose of signaling sentiment. For us, that meant using a loud stop-sign like red for the tag “Reject” to tie the color to the action. Other options could include red for anger, yellow for neutral, green for happiness, blue for calm; these colors are a good framework. They are well known and easy to recognize for anyone jumping into the tagging process.
Lesson 7: The Wheel of Emotions
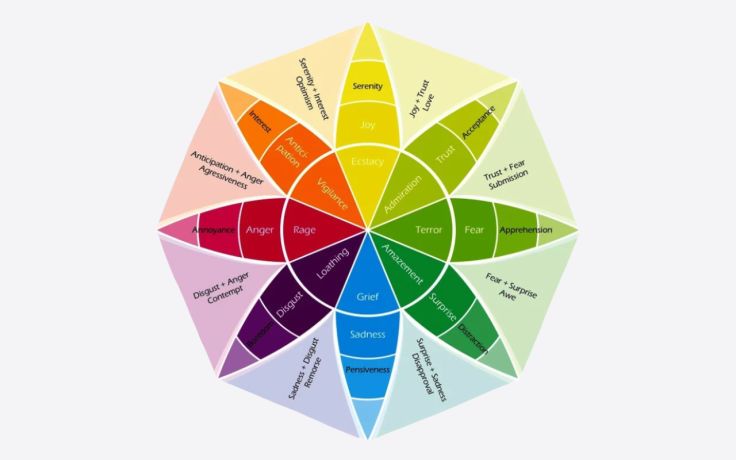
In our experience, it is extremely useful to tag nuggets and research observations with emotions raised by participants during the reported observation. When you slice and dice the data later on, this allows you to find answers to questions such as, “What makes our customers in The Netherlands angry?” (just an example, Dutch friends…).
Tagging emotion gets tricky. Dealing with emotion and how it relates to tagging is never going to be perfect. A common practice we chose to draw from is Plutchik’s Wheel of Emotions. The emotions wheel describes eight basic emotions, providing a broad enough spectrum for most users’ sentiments to be tagged within the framework. We strongly recommend to avoid leaving the emotion tag open-ended, as our experience with such a situation has not been satisfactory. Researchers tended to freely add emotions that were not really emotions (e.g., ‘Feeling informed’).
Ensuring the quality of a tagging taxonomy
Naturally, you won’t have all of the information you need when first building out a taxonomy. For this reason, use your research data to inform how your taxonomy grows, and be honest when a tag is either no longer serving a purpose or is missing and needs to be added. It’s important to edit and evolve the taxonomy alongside your growing body of research.
Lesson 8: Define, and then refine
Tagging is an art, not a science. It’s a constant learning process, and we iterated many times over as we began to better understand how tags supported our work.
As such, we had multiple conversations about what tags meant; by discussing and refining, we ensured our team was uniformly aligned and applying each tag correctly.
All that is to say: Be flexible. Regularly discuss tagging practices and reevaluate what is working and what is not. In our case, we discovered that “Keywords” would be really helpful for our study. We were given free rein to add values under the keywords tag without limits. Through this exercise, we began to see which keywords were popping up often and which ones may have been one-offs that no longer brought value. This allowed us to consolidate overlapping keywords and remove tags that were deemed irrelevant.
Lesson 9: The golden nugget tag
Finding a golden nugget is similar to Charlie finding a golden ticket in the Chocolate Factory. It’s such an exciting moment; it seems too good to be true! A golden nugget is a quote or highlight that stands on its own, well-articulated by the participant, or one which makes a strong case that is hard to dismiss. Golden nuggets suggest major challenges with the brand or a key finding and will be used in the future to represent a point made by multiple other participants.

The above nugget portrays such a strong sentiment in how it relates to the work from home experience. In it, the participant takes an overt stance, proclaiming that “nothing could offset the freedom” of working from home. This statement was significant because it signaled to us the tradeoffs participants were weighing when thinking about the future of work. Although golden nuggets are hard to pin down, we highly recommend including that tag in your taxonomy.
Lesson 10: Less (values) is more
Anytime you find yourself questioning whether you should tag something, that probably means you shouldn’t. One tag where this was particularly relevant for us was the “Experience vector” tag. This tag was meant to capture whether the participant had a positive or negative experience working from home. Sometimes though, the vector is neutral. For that reason, we only created two values for the experience vector tag – positive and negative – while deciding that a neutral vector will not get any value, which implies its neutrality. We recommend this approach rather than overloading your taxonomy and adding a third neutral value.

In summary, a tagging taxonomy is one of the most critical components of Atomic Research and will make or break your organization’s ability to gain meaningful insights from users and customers. Done wrong, it might pull the rug from beneath researchers and hurt the trust their organization has put in them to provide valid and reliable insights. Anyone with experience creating tagging taxonomies has learned a lot about what works and what doesn’t. In this article, we shared ten lessons we learned in the past five years about planning, organizing, and ensuring a quality tagging taxonomy. We’d love to learn about your experience doing so as well.
Written by Tomer Sharon, UX author and cofounder at a stealth mode startup. Ex-Google, WeWork, and Goldman Sachs; Ada Ruzer, Design Recruiter and UX Researcher Associate. Ex Airbnb and Shelly Yichoy, User Research Intern and Applied Psychology Graduate Student, University of Southern California.


