Did bad data drive your last decision?

The only game where being good at whispering means you're bad at winning.
We live in a data-driven world—but too often the data we rely on for decisions is misused or straight-up wrong.
Did you know that 87.5 percent of all UX research-generated statistics are false?
87.5 percent!
Wow!
Actually, that’s not true. I made it up.
But did you believe me, even for a second?
Is it because I used numbers? Or because you’re reading an article in a publication you’ve grown to trust, written by a research expert?
This might happen to you in daily life, too. Think of all the “research” thrust upon us—in commercials, billboards, and news articles. I grew up with television commercials telling me all sorts of convincing things, like “four of five dentists surveyed recommend sugarless gum for their patients who chew gum!” Something about those numbers made me believe—Trident gum wasn’t only delicious but somehow healthy because dentists liked it.
What is it about the process of creating and sharing these statistics that makes them so compelling to humans? Joel Best, the author of the book Damned Lies and Statistics, says that all statistics are products of social activity, a process sociologists call social construction. He says we “assign statistics ‘facticity,’ that is, they are presumed to be facts.”
When we want to understand the extent of a problem, intervention, or other issues, we tend to treat statistics as objective and indisputable. In the process, we ignore how these numbers were created or how they are being shared—or by whom.
We also deal with these social processes in professional contexts: at work and in our broader network, like on LinkedIn. Let’s start with an example from the latter.
When experts endorse faulty research findings
I recently spotted a perfect storm after reading a recent post by Steve Blank. In it, he references an article titled, Startups That Have Employees in Offices Grow 3 1/2 Times Faster.
His post reads: “Data shows that pre-seed and seed startups with employees showing up in a physical office have 3½ times higher revenue growth than those that are solely remote.
Let the discussion begin.”
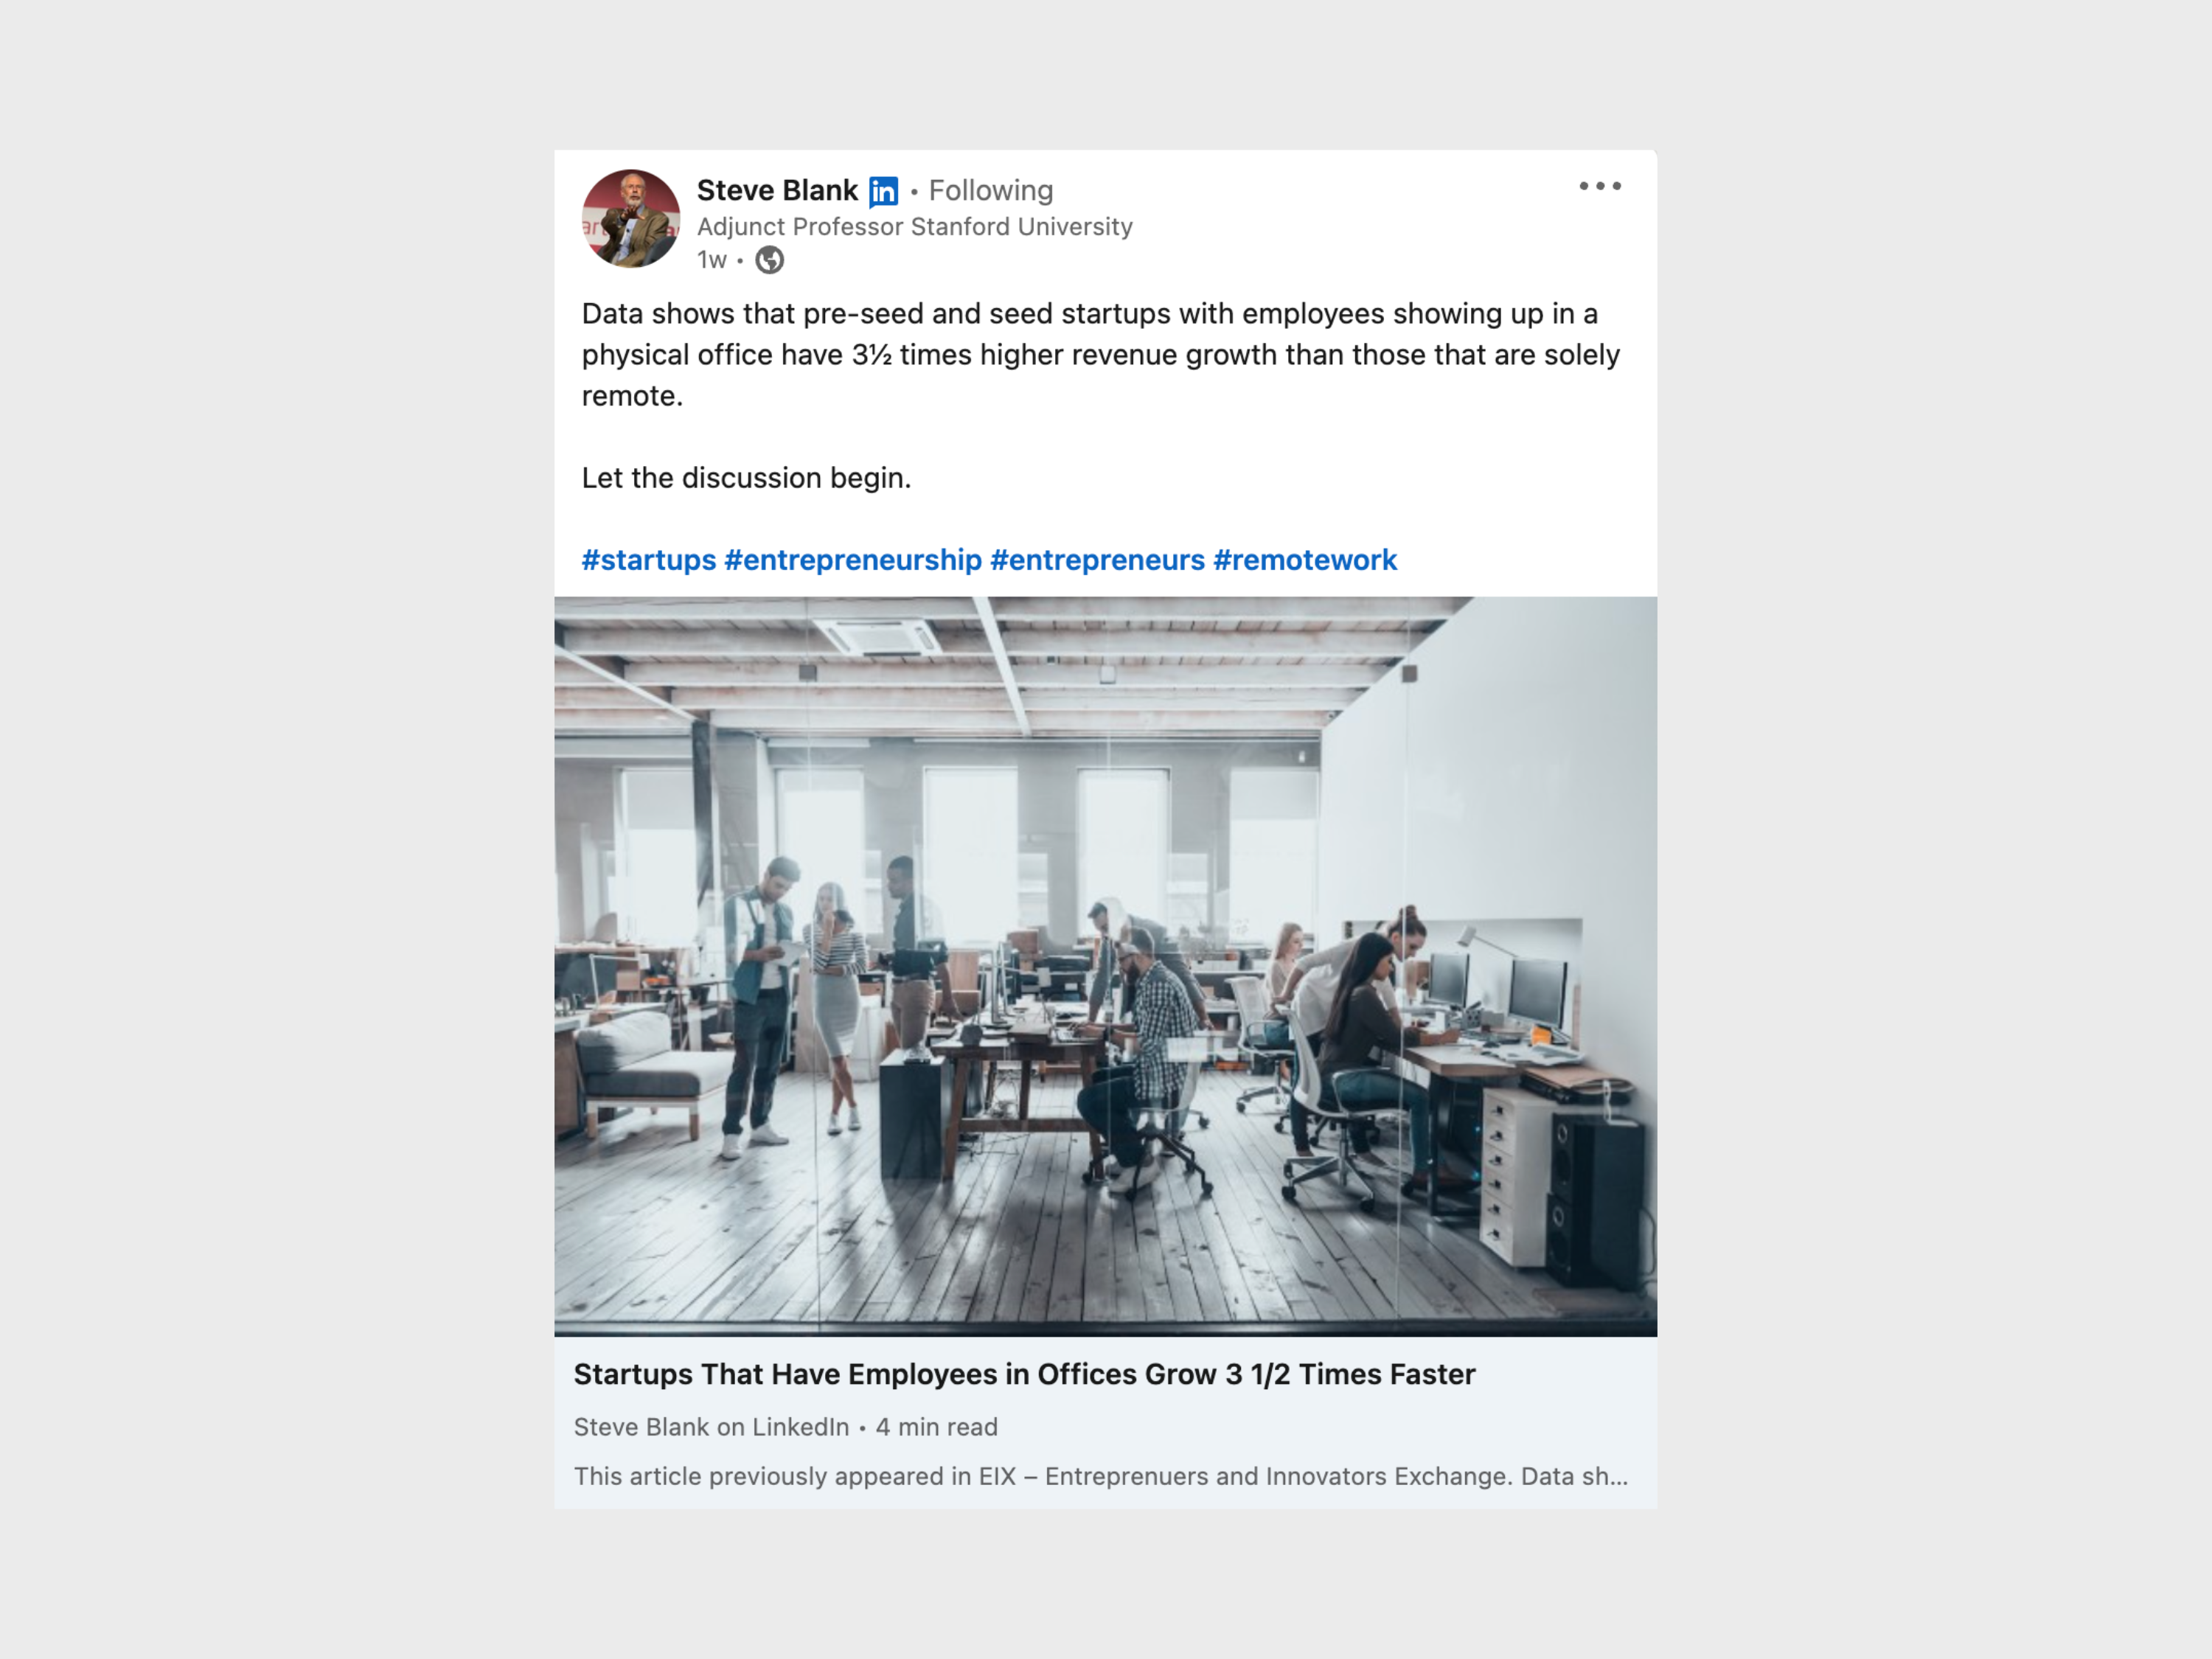
Source: LinkedIn.
The discussion did indeed begin.
After I dove into the data on which the article is based, it turns out the headline is quite misleading. My comment on his post, reproduced below, looks more closely at why.
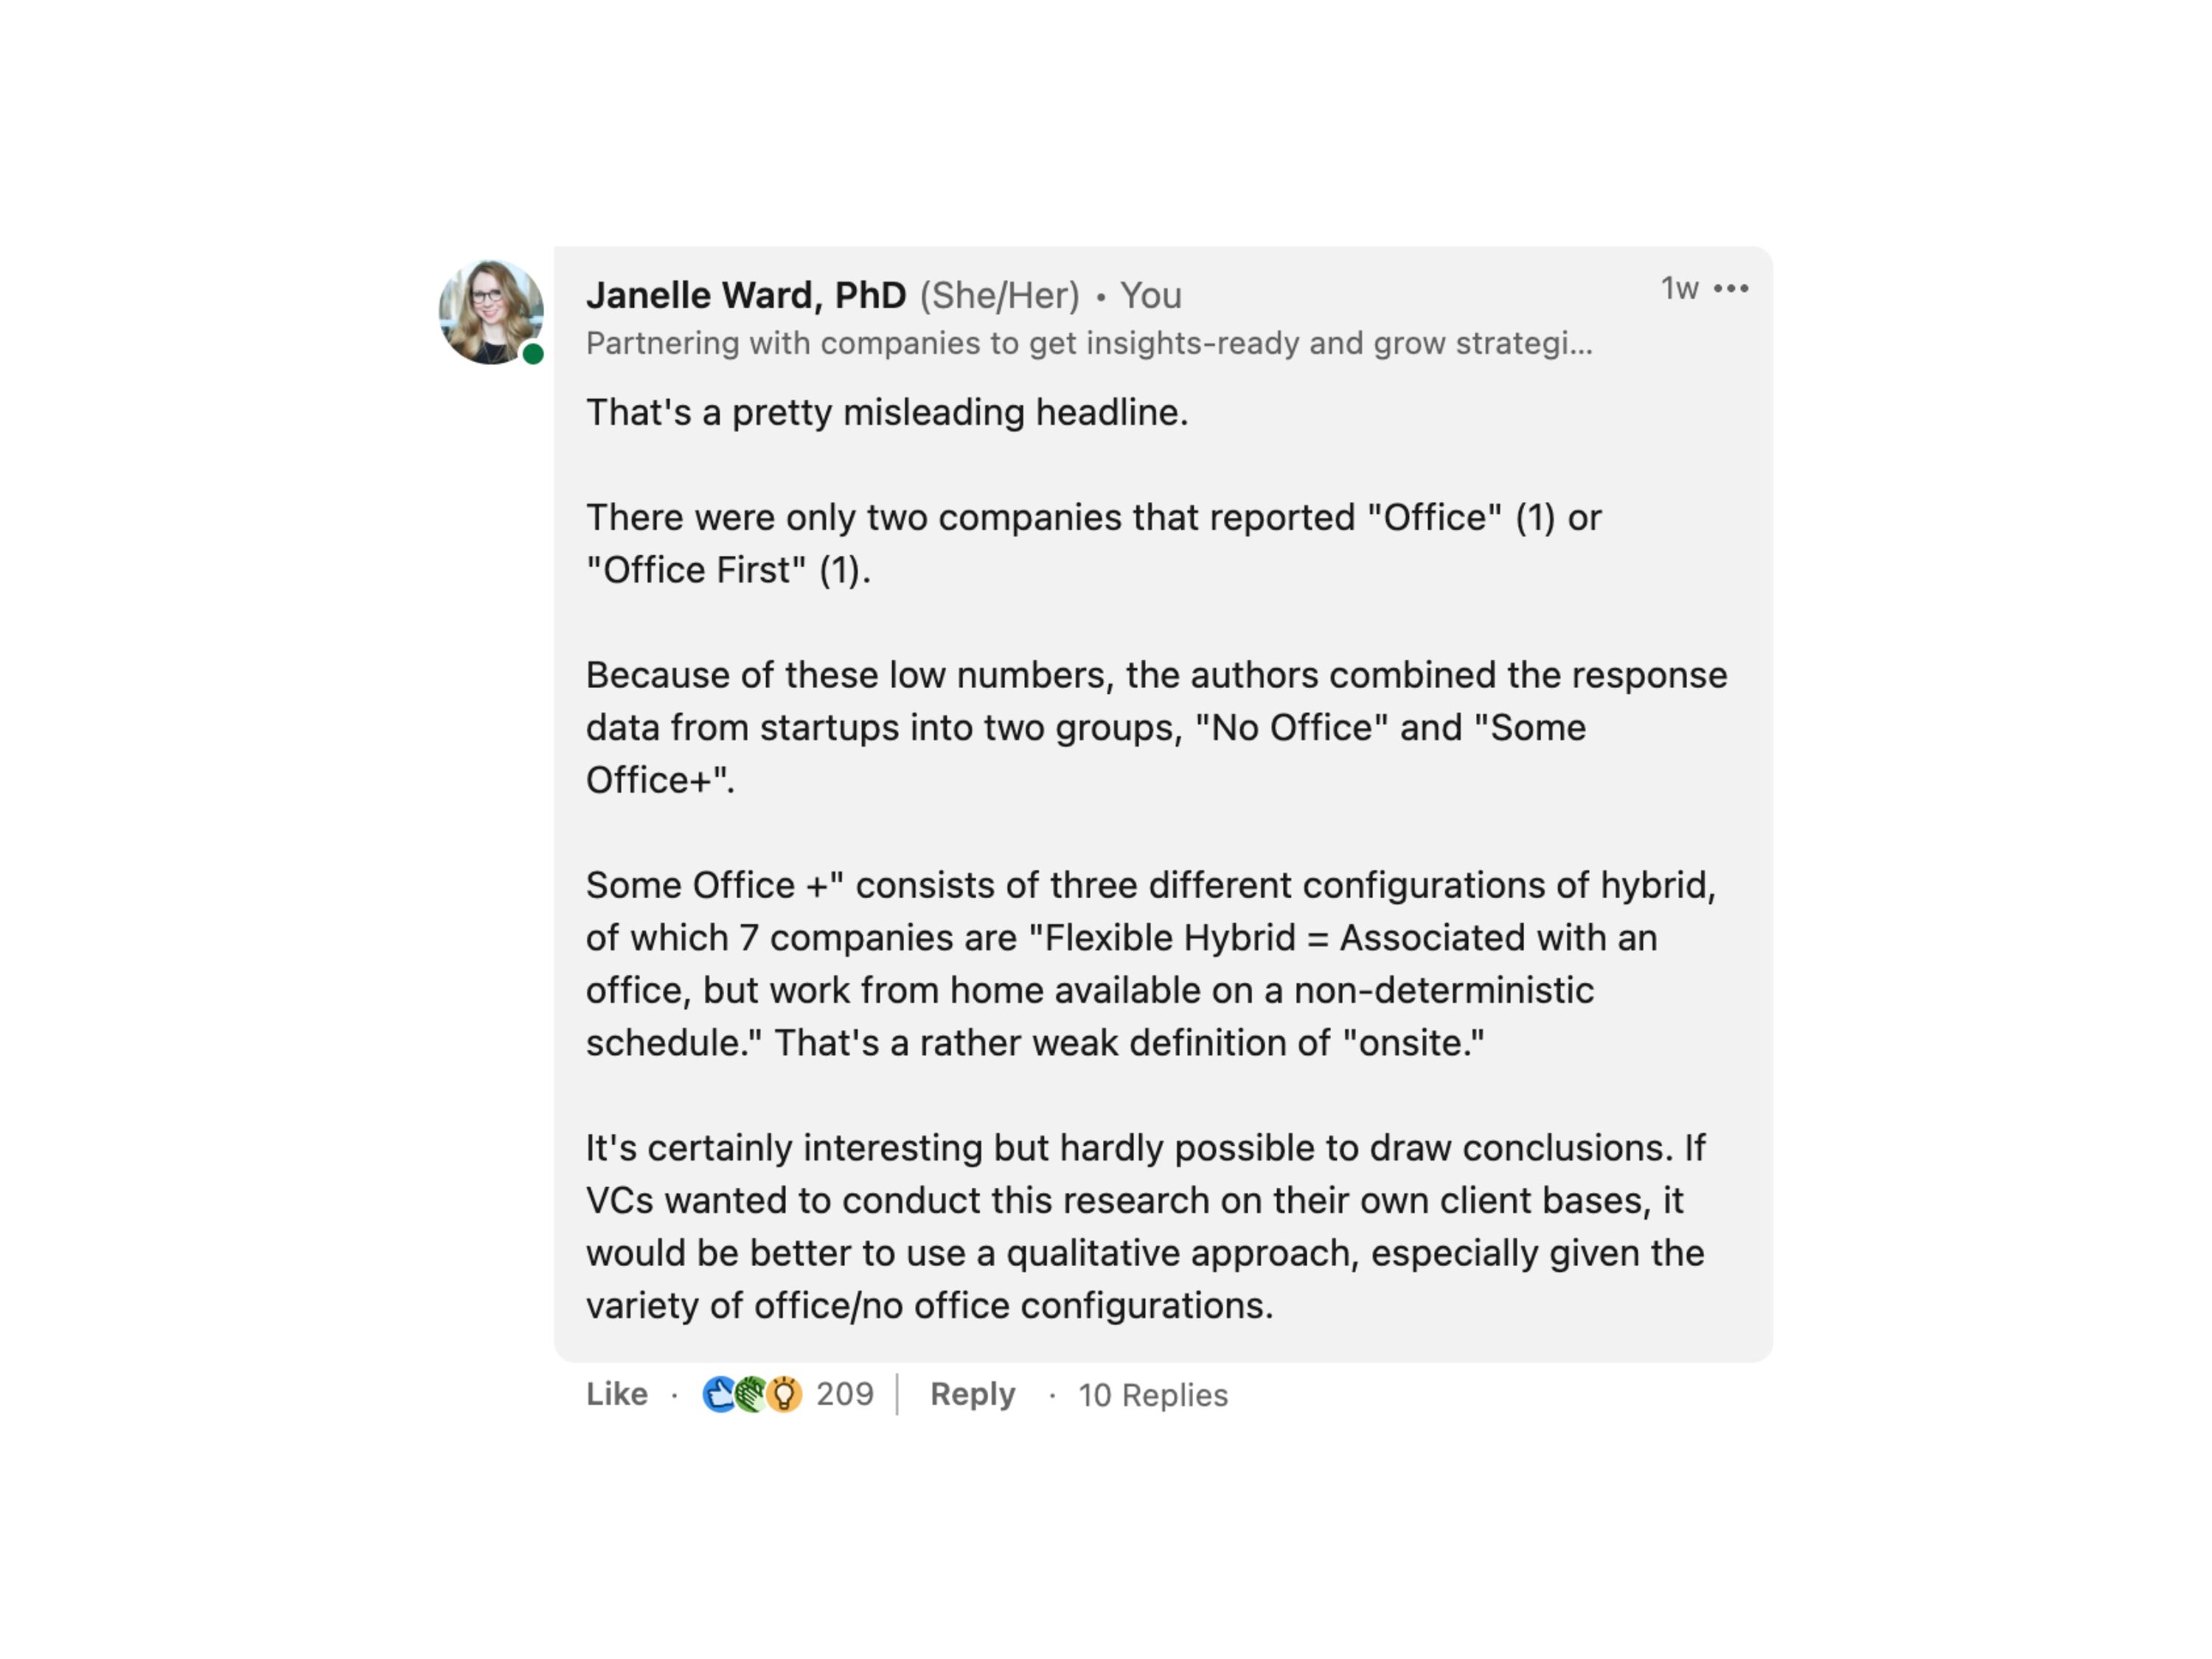
Source: LinkedIn.
When you look at the comments on Steve Blank’s post, you see lots of questions criticizing the data. Hello, critical readers! Nice to have you here.
But you also see a lot of comments from company leaders running with the headline, posting things like:
“Humans are social creatures by nature.”
“...in my bones, I believe people can co-create more fluidly if they do it in the same room.”
“I’m not even surprised.”
A well-known figure looks at a poorly executed study, writes an article about it, and shares it with a misleading headline.
At work, we are surrounded by the result of poorly-informed decisions every day: This is one example of how it begins.
This example isn’t about debating remote versus in-office culture or how this differs based on company size, industry, or other factors. It’s about considering how people in leadership positions—people, in this case, who may hold the power to force employees back to the office—are possibly making a decision based on a dubious post.
A dubious post that used a small study, which drew on questionable definitions of “in office,” then shared by a VIP in the business world.
It’s not just the numbers: qualitative research can also be misleading
It’s easy—especially for those more qualitatively inclined—to sit back and judge those who take numbers at face value. We know it’s more complicated than that. The world can’t be whittled down to multiple choice or percentages.
Not so fast. This happens with qualitative data too, and the result can be even more disturbing in some ways. Certainly, people do not always understand the statistical methods used to generate certain results. Additionally, they also may not know how we analyze qualitative data.
Truthfully, analyzing qualitative data can be (even) less transparent. The danger, then, is that people can pull out a finding and say they don’t “need” more people to validate its veracity.
Here’s an example: Stakeholders who run with a single, qualitative data point—encouraged by an advocacy-driven researcher.
It’s popular in the UX research world to keep stakeholders abreast of our ongoing research projects. I’ve heard of many researchers who post updates immediately following user interviews, for example, by providing an interesting quote from the interview and posting it in a larger internal Slack channel.
Imagine this: A non-research stakeholder sees the quote and reposts it across the company as “proof” that “improving our information architecture is priority number one!”
When that study was completed, it turned out that this was an isolated comment from one interviewee, which stemmed from a misunderstanding.
The quote, in and of itself, was highly compelling and drove interest in the research project. But the interest was misplaced.
The ball had already started rolling. That quote made it to a VIP decision-making table. You know, the one where roadmaps and OKRs are planned.
Later, of course, those people also decide whether research provided an accurate path forward—or not.
How can researchers address these situations in the workplace?
What can we, as researchers, do to encourage others to think more critically about data? This can be tricky, especially when the data being held up as “truth” comes from the mouths of leadership. Here are some suggestions:
- First, ensure that the data we present is rigorous. If it’s not, we need to provide the necessary caveats. Even if it is, we need to be transparent about how we collected and analyzed our quantitative or qualitative data and articulate the choices we made to get to the conclusions we reached. Remember: There is no research without rigor
- Ask “innocent” questions. Sometimes, feigning ignorance can be a good way to let someone know they might need to pay more attention to the sources they are referencing in an argument. If your Head of Product is excitedly touting a data point she heard in a recent exec meeting, find out where it came from and how relevant it is to the specific topic at hand
- Educate our non-research stakeholders through collaboration. When we conduct research collaboratively with non-researchers, we can use the opportunity to walk them through our process and our decision-making about how we choose to conduct our research. Although it can feel counterintuitive to vocalize trade-offs or doubts, it may also have the effect of increasing their awareness of the complexity of the project
- Draw inspiration from our peers. Anat Mooreville, Ph.D. provides an excellent example of how we can approach complex data in a straightforward way with a recent post that breaks down a study examining average credit scores across the United States. She ends her post with a conclusion from which we should all draw inspiration: “Only those who are truly willing to test their hypotheses—rather than rubber stamp them—will get to these insights that change the conversation”
Did bad data drive your last decision? If you’re a researcher, I hope not. But we all slip up sometimes. The good news is that, with our training, we have the tools to look more critically at our own—and our stakeholders’—choices.
Subscribe to Outlier
Juicy, inspiring content for product-obsessed people. Brought to you by Dovetail.